Webfleet Solutions and Geotab tell us how commercial mobility is recovering in Europe
Webfleet Solutions and Geotab (here a recent Geotab study on the impact of electrification on CO2 emissions) presented a new dashboard for the commercial mobility recovery program after the lockdowns due to the pandemic outbreak. The dashboard analyzes the activity of more than 3 million connected vehicles from 100,000 anonymous customers worldwide, with the aim […]
Webfleet Solutions and Geotab (here a recent Geotab study on the impact of electrification on CO2 emissions) presented a new dashboard for the commercial mobility recovery program after the lockdowns due to the pandemic outbreak. The dashboard analyzes the activity of more than 3 million connected vehicles from 100,000 anonymous customers worldwide, with the aim of understanding the impact of the Covid-19 pandemic on commercial vehicles in all countries of Europe and North America.
To understand more, we interviewed Marco Federzoni, Sales Director Italy at Webfleet Solutions and Fabio Saiu, Leasing and Renting European Director at Geotab. The second and last part of the interview will be published next week.

The project curated by Webfleet Solutions and Geotab
Is it possible to have some more technical details about how the dashboard works? How the data is collected and processed, which technologies are used, etc.
Marco Federzoni, Sales Director Italy at Webfleet Solutions: «The dashboard for the commercial mobility recovery program analyzes aggregated and anonymized data from over 3 million connected vehicles from over 100,000 combined Webfleet Solutions and Geotab customers in Europe and North America. It represents the daily activity of these vehicles. The activity refers to the journeys, the daily volume of journeys made by commercial vehicles in the country. All data is anonymized and aggregated and then compared with the baseline. The benchmarking calculates the current levels of fleet activity as a percentage of the level of commercial fleet activity experienced prior to the adoption of measures to halt the spread of Covid-19. This allows users of the dashboard to gain an overview and clarify the impact of these measures on fleet activity.
The data is aggregated in three ways: daily by country, daily by country and by sector, and weekly on nine territories (Italy, United Kingdom, Germany, Netherlands, Spain, France, Canada, United States and Mexico). Both companies give the highest priority to the protection of customer data and the absence of sensitive data. In preparation for the creation of this dashboard, we reviewed the common metrics that both our companies collect and then merged the information into a single database aggregate for reporting».
In addition to mapping the general situation of the commercial fleets in the various countries where it is present, the Geotab and Webfleet Solutions dashboard can also compare the performance of the various transport modes (long-distance, first and last mile, intermodal, etc.) before and after the Covid-19 pandemic?
Federzoni: «In addition to comparing the fleet performance in the various countries, the dashboard also gives specific information on commercial activities related to vehicles for the construction, business services and freight transport sectors. Data is only available at country and sector level. The aggregated travel volumes of several customers are analyzed on a daily basis. Aggregated data must be composed of several customers and cannot be journeys characterized by a single customer for a particular region or sector».
GEOTAB AND THE EVALUATION OF BATTERY DEGRADATION
What is the trend in commercial vehicle traffic since 3 June? What are the most significant differences between Italy and the other European countries?
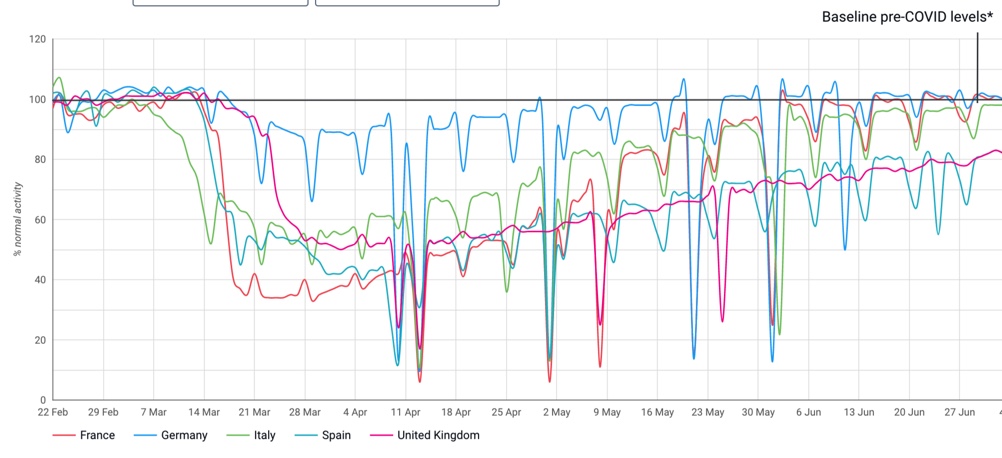
Fabio Saiu, Leasing and Renting European Director at Geotab: «Access to reliable and deep data can be a real challenge and it is easy to be overwhelmed by so much information in a complex situation like the pandemic. This dashboard aggregates anonymous data from over 3 million commercial vehicles in Europe and North America and provides an accurate snapshot of how the economy is recovering from pre-emergency levels. An analysis of the last few weeks shows that commercial activity in Italy has recorded a significant but gradual recovery compared to the pandemic period. At the Italian level, the figures for the comparison of recent weeks show a curve that is stabilizing: at the beginning of June the percentage of recovery in commercial vehicle activity was around 93-94%, the current figure is 96-97%.

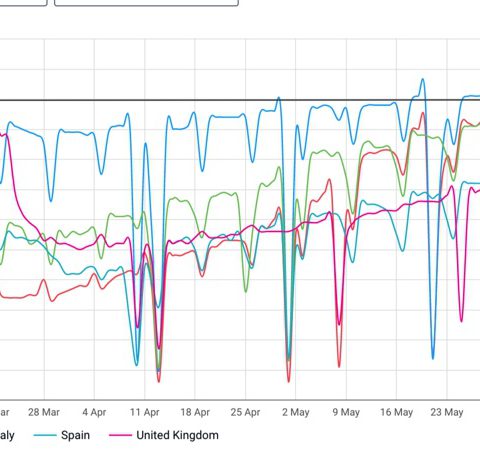
The European countries considered in the dashboard are experiencing a situation of stabilization and gradual recovery similar to the Italian one. The figures for the week of 15/6 compared to last week of 22/6 show an increase in commercial activities of 3% with an overall recovery rate of 93%.
Generally speaking, in the European context, Italy is among the most advanced countries in the recovery phase among those examined, preceded only by Germany and France – in first and second place respectively – which even exceeded pre-Covid levels in some moments. Spain and the United Kingdom, on the other hand, are the countries that are experiencing the greatest difficulties in recovering».
*Data refer to the dashboard update as of Monday 29/6
(To be continued next week)